SHARE
SHARE
Understanding Different Types of Sales Reports and How to Create Them
Sovia
Managing a business without monitoring sales reports is like trying to reach a goal without a clear direction. While the end goal may be set, without clear data, the journey can be filled with obstacles. This is where sales reports play a crucial role. These reports are not just a collection of numbers, but also a strategic guide for making better business decisions.
In this article, we will discuss what a sales report is, its importance in business, the different types of reports, and the steps to create an effective sales report.
What is a Sales Report?
A sales report is a document that summarizes the operational details of a business's sales over a specific period. This report typically includes data such as the number of sales made, prospects, new accounts, as well as revenue and operational expenses during that period.
In addition to serving as a transaction record, a sales report also functions as an analytical tool. Businesses can use it to evaluate each stage of the sales funnel, adjust marketing strategies, and develop more effective growth initiatives.
A sales report also provides valuable insights into the effectiveness of sales methods, sales trends and forecasts, performance comparisons with previous periods, and a better understanding of customer motivations. With this information, businesses can make more informed, data-driven decisions.
The Importance of Sales Reports in Business

Source: freepik.com
Sales reports play an essential role in providing a comprehensive view of sales performance over a given period. With this report, companies can assess sales performance and develop more effective strategies to improve future results.
Moreover, sales reports help identify areas that need improvement so the business can grow more optimally. This document also serves as a transparency tool for investors and reflects the company’s credibility in managing its operations.
Types of Sales Reports
Sales reports are crucial for helping businesses understand sales performance and optimize their strategies. There are several types of sales reports, each depending on the metrics being measured. Here are some sales reports that can help your business grow:
1. Monthly Sales Report
- Sales KPI Report
This report contains Key Performance Indicators (KPIs) for sales, helping you track sales progress and adjust business strategies. You can categorize costs, monitor incremental sales, and compare current sales results with previous months.
- Sales Forecasts
This report predicts the sales the team is expected to achieve in a specific period. You can use it to anticipate seasonal slowdowns or plan strategies for overcoming business challenges.
- Sales Cycle Length Report
This report covers the entire sales process, from opportunities to closing deals. With this report, you can evaluate the sales team's performance and see how long it takes to close deals with customers.
- Sales Conversion Report
This report measures the effectiveness of prospects throughout the sales funnel. It includes information on the number of contacts, generated prospects, and business achievements over time. You can create this report monthly, weekly, or even daily.
- Sales & Order Report
Managing a large number of orders can be cumbersome. However, with this report, you can easily track the number of orders coming in, being processed, shipped, or returned. If there are issues in the order process, you can quickly identify the cause and resolve it.
- Sales Performance Report
This report provides an overview of sales performance in a given month. It covers various KPIs, allowing you to evaluate the business's overall performance.
2. Weekly Sales Report
- Outbound Call Report
This report tracks calls made to prospects and customers to encourage purchases. From this report, you can assess the sales team’s effectiveness and understand the quality of prospects generated.
- Upsell and Cross-Sell Report
This report details the number and value of products sold through upselling or cross-selling techniques. With this report, the sales team can identify future sales opportunities.
- Customer Lifetime Value Report
This report estimates the potential value of each customer. You can monitor this report weekly to see if the value is increasing or decreasing. The goal of this report is to retain customers for as long as possible to maximize their contribution to the business.
- Conversion Report
Similar to the monthly sales conversion report, this one is made weekly. It contains the number of prospects converted at each stage of the sales funnel, as well as information about contacts and qualified prospects.
- Rate of Return Report
This report helps you understand the rate of product returns from customers. By knowing the reasons behind returns, you can find solutions to reduce returns and improve the quality of your products or services.
3. Daily Sales Report
- Number of Meetings Scheduled by Representatives
This report tracks the number of meetings scheduled by the sales team daily. While it doesn’t guarantee customers will agree to meet, it helps monitor the team's effectiveness in scheduling meetings with prospects.
- Number of Sales Opportunities
This report records the number of sales opportunities generated from qualified prospects. These opportunities can be conversations that lead to meetings, opening the door for future transactions.
- Number of Lost Customers
Unlike other reports, this one helps you track the number of customers who have stopped transacting. There are various factors that could cause customers to leave, and this report can help identify the reasons behind it.
- Number of New Prospects
This report is fairly simple, as it only tracks the number of new prospects acquired by the sales team. This data can be used to assess whether the strategies in place are effective in attracting new customers.
- Number of Closed Sales/Offers
This report shows the number of transactions successfully closed in a single day. It is especially important for businesses that sell large quantities of low-margin products, as the more transactions made, the higher the profit.
Read more: What is a POS System for Restaurants and How Does It Work?
How to Create a Sales Report
1. Determine the Type of Report Needed
The first step in creating a sales report is deciding which type of report you need. Choose the format that fits the data being presented. A sales report isn’t just numbers and explanations, it should also be visually appealing and easy to read. To simplify the process, you can use sales report templates or CRM applications to generate multiple types of reports more efficiently.
2. Know Your Audience
Who will be reading this report? If the report is intended for internal teams, you may need to include more detailed KPIs. However, if the report will be presented to executives, it’s better to keep it concise, clear, and include the most relevant information from various reports. By understanding your audience, you can create a more relevant and effective report.
3. Set the Reporting Period
After determining the report type and audience, the next step is to set the sales report’s period. Will it be presented daily, weekly, monthly, or annually? Don’t forget to compare the data with the previous period so you can track sales trends and see if there’s an increase or decrease.
4. Include Relevant Information
Knowing your audience and reporting period will help you decide what data to include. Choose the most relevant information to keep the report concise and clear. If necessary, you can also exclude some data sets that are less important for the current business context.
5. Use Graphs for Data Visualization
A sales report filled with numbers can be difficult to understand and may confuse the audience. Therefore, use graphs and data visualizations to clarify the information presented. You can take advantage of sales report apps that can automatically convert Excel data into graphs, making the report more engaging and easier to comprehend.
6. Double-Check Data and Information
Before presenting the report, make sure all the data and information are accurate. Don’t hesitate to add supplementary information, refine graphs, or discuss with your team to ensure the report meets the needs of the business.
7. Present the Sales Report Clearly
The final step is to present the report with clear explanations. Ensure that the narrative you create supports the figures shown and provides a clear overview of strategies or improvements to be made moving forward.
Read more: 9 Ways to Create Inventory Reports for Restaurants and Culinary Businesses
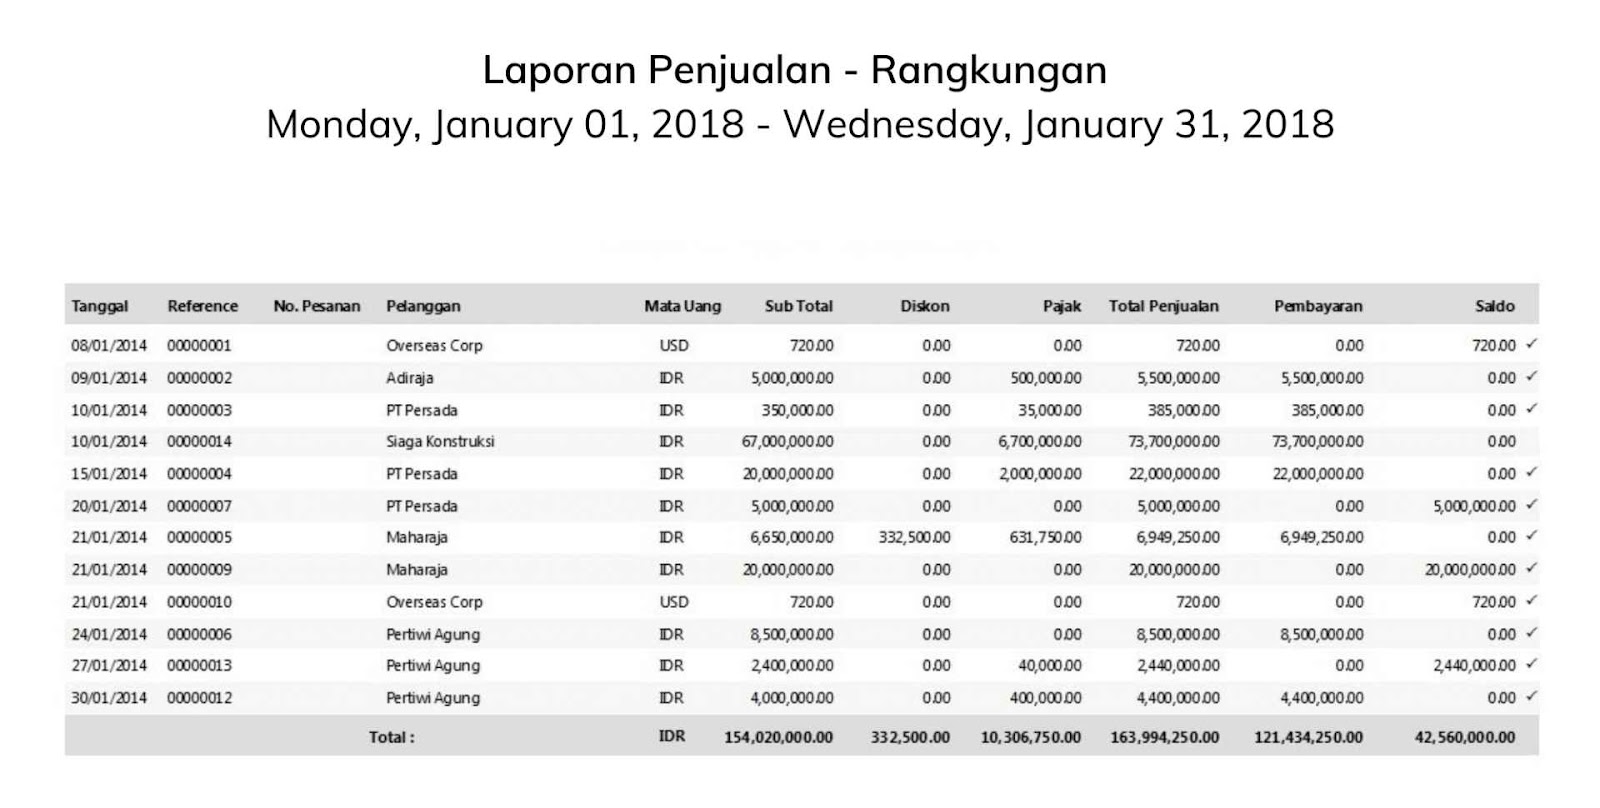
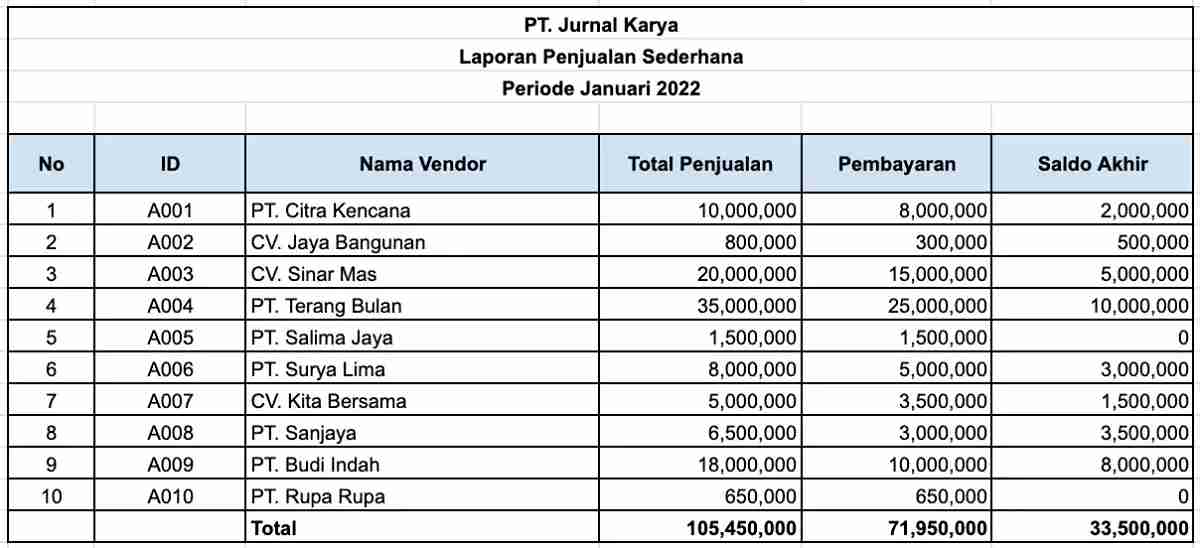
Example of Sales Report
Below are some simple examples of sales reports:
Source: templates.office.com
Source: jurnal.id

Source: bukumitra.id
Conclusion
A sales report is not just a collection of numbers, but an essential tool for understanding business performance. With clear and structured reports, businesses can make more informed decisions.
Manage your business’s sales reports more efficiently by utilizing solutions like OLIN by ESB. With features like data tracking, financial analysis, and integrated sales reporting, you can focus on larger business strategies. The OLIN dashboard provides real-time business analysis, such as sales potential, helping you manage sales reports with greater ease and accuracy. Optimize your culinary business now with OLIN by ESB!
SHARE